
Regression is most often used by scientists and engineers to visualize and plot the curve that best describes the shape and behavior of their data.
Regression procedures find an association between independent and dependent variables that, when graphed on a Cartesian coordinate system, produces a straight line, plane or curve. This is also commonly known as curve fitting.
The independent variables are the known, or predictor, variables. These are most often you X axis values. When the independent variables are varied, they result in corresponding values for the dependent, or response, variables, most often assigned to the Y axis
Regression finds the equation that most closely describes, or fits, the actual data, using the values of one or more independent variables to predict the value of a dependent variable. The resulting equation can then be plotted ever the original data to produce a curve that fits the data.
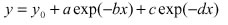
A piece of data collected from a decaying phenomenon is to be regressed to an equation.

 The multiple correlation coefficient, and R2, the coefficient of determination, are both measures of how well the regression model describes the data. R values near 1 indicate that the equation is a good description of the relation between the independent and dependent variables.
R equals 0 when the values of the independent variable does not allow any prediction of the dependent variables, and equals 1 when you can perfectly predict the dependent variables from the independent variables.
Therefore, from the obtained R and R-square, the experimental data fit to a 5-paramter decaying function in a satisfactory way.
